Login / Register
Ceph is typically deployed as an object store using HDD storage with small amounts of NVMe for Bluestore (metadata + write ahead log). Micron recently completed testing on an all-NVMe Ceph configuration with a Micron 6500 ION as storage for both data and Bluestore. While the performance of the 6500 ION over the Solidigm P5316 is compelling, we also wanted to know the performance delta between a more common Ceph deployment with HDD + NVMe and one with the Micron 6500 ION.
A major HDD vendor released a technical brief detailing Ceph performance in a 4-node cluster using 12 12TB 3.5” SATA HDDs and one NVMe add-in card SSD for Bluestore. Both solutions were tested with RADOS Bench, Ceph’s tool for measuring object throughput from clients or S3 gateways. There are some architecture differences detailed in this report, but even taking those into account, the difference between Ceph with the Micron 6500 ION and Ceph with HDD + NVMe is dramatic.
Performance
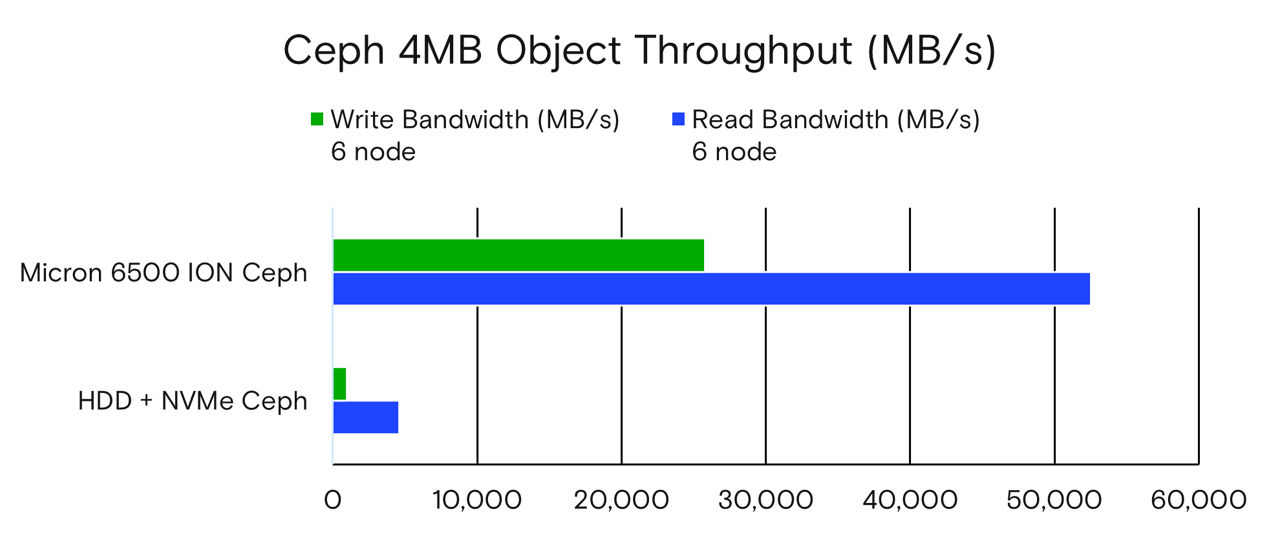
• The Micron 6500 ION Ceph configuration showed 11 times the read performance and 27 times the write performance.
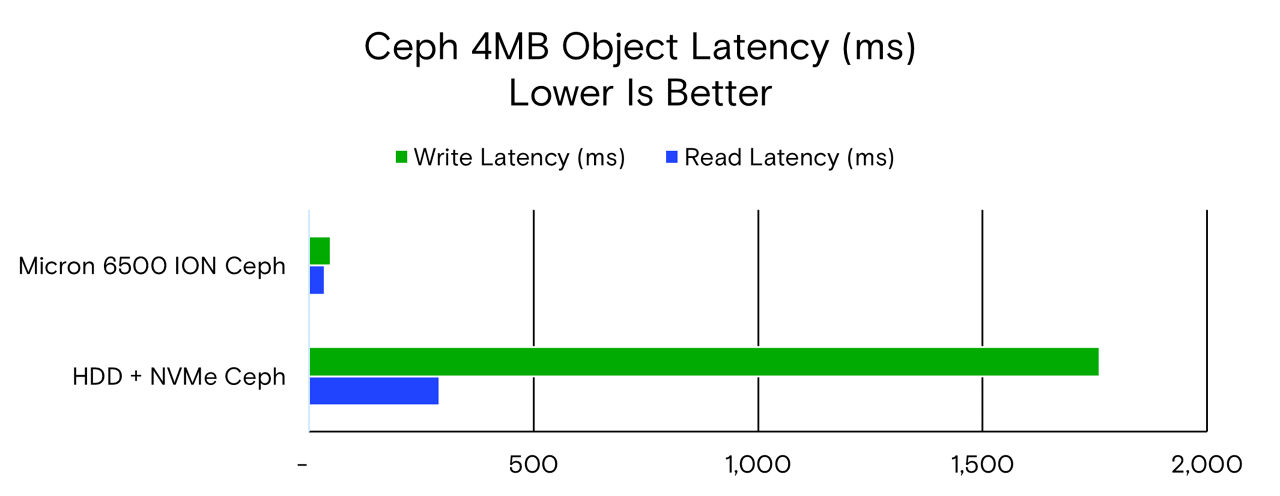
• The HDD + NVMe Ceph has eight times higher read latency and 37 times higher write latency.
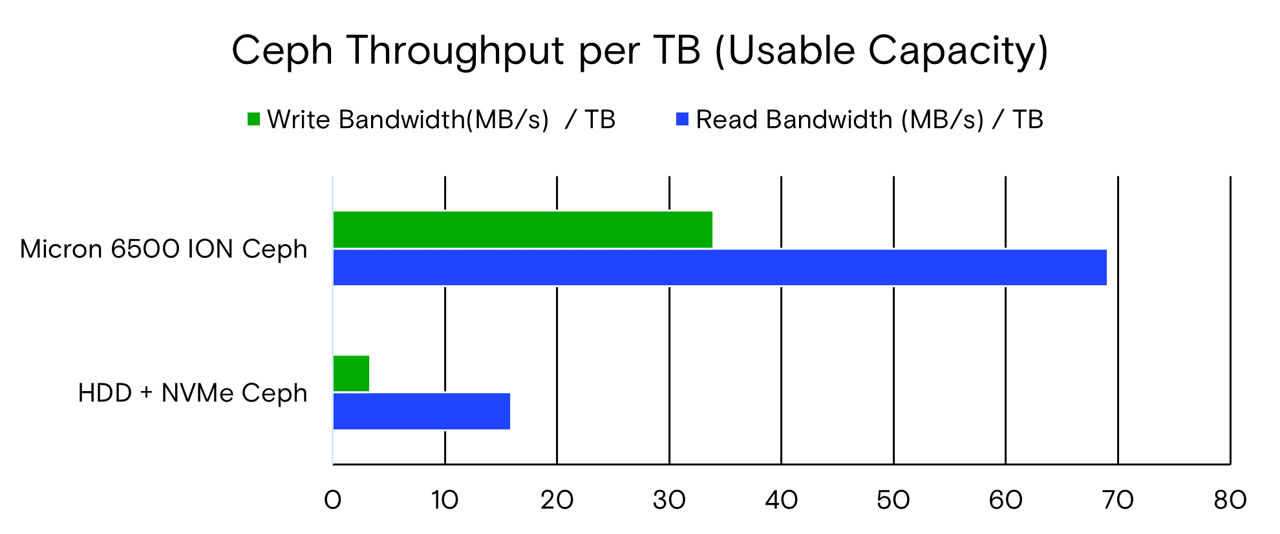
• The Micron 6500 ION-based Ceph cluster is more performant per usable TB, with four times the read performance per TB and 10 times the write performance per TB.
Power efficiency
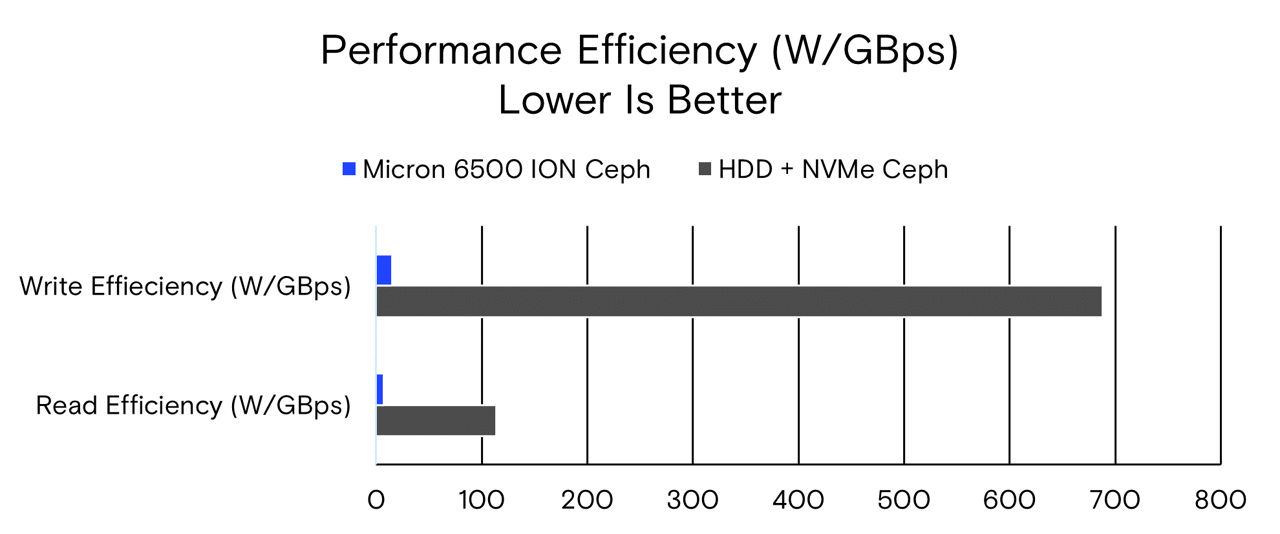
• The Micron 6500 ION-based Ceph has double the storage power efficiency (watts per TB or W/TB) while power/throughput is 16 times higher for reads and 46 times higher for writes.
Cost
• Cost per usable capacity for both solutions is roughly equivalent because NVMe storage is much more performant. A person can use 4+2 erasure coding with the all-NVMe cluster at this scale, but doing the same is not recommended for HDD, requiring 3x replication instead.
- It would take 16 HDD + NVMe Ceph nodes to match the usable capacity of the 6-node Micron 6500 ION Ceph configuration (add simplified formula to validate claim).
- It would also take 68 HDD nodes to match the 6-node Micron 6500 ION Ceph read performance and 161 HDD nodes to match Micron 6500 ION Ceph configuration write performance (add simplified formula to validate claim).
Test environment
Hardware Config |
Micron 6500 ION Ceph |
HDD + NVMe |
Number of OSD Nodes |
6 |
4 |
Server Size |
1 RU |
1RU / 2RU |
CPU |
AMD 74F3 (24-core) |
Not Listed |
DRAM |
64GB |
|
NVMe |
Six Micron 6500 ION 30TB |
One NVMe AIC |
HDD |
None |
12 3.5” HDD 12TB |
Network |
200GbE | 10GbE |
Software Config |
Micron 6500 ION Ceph |
HDD + NVMe |
OS |
Ubuntu 20.04 HWE (Kernel 5.15) |
Not Provided |
Ceph Version |
Quincy (17.2.5) |
Not Provided |
Benchmark |
RADOS Bench 4MB |
RADOS Bench 4MB |
Ceph Pool Config* |
4+2 Erasure Coding |
3x Replication
|
*For NVMe testing, 4+2 erasure coding showed a 15% reduction in read performance over 3x replication and a 27% increase in write performance over 3x replication. See the following Micron technical brief for more details: Low-Latency NVMeTM SSDs Unlock High-Performance, Fault-Tolerant Ceph® Object Stores
Detailed results
Because the HDD + NVMe test used fewer nodes and 3x replication instead of 4+2 erasure coding, we wanted to even the comparison by factoring in those differences.
Node difference (node perf. multiplier):
• We multiplied HDD + NVMe bandwidth results by 1.5 to simulate a 6-node configuration (assuming linear performance scaling)
• We kept average latency the same as reported in the HDD technical brief.
Data protection difference (data protection perf. multiplier):
• Read performance: 4+2 erasure coding had a 15% penalty on read performance for the cluster. We did not change the results of the Micron 6500 ION test (increase), nor did we reduce the performance numbers of the HDD + NVMe configuration. This approach will advantage the HDD configuration.
• Write performance: 4+2 erasure coding had a 27% increase in performance over 3x replication in an all-NVMe test. While we do not believe the same level of performance is achievable on HDD’s, we multiplied the HDD results by 1.27 to account for that potential increase. This approach will also advantage the HDD configuration.
The data protection performance deltas were measured by Micron, and more detail can be found here.
Read and write performance
The Micron 6500 ION Ceph configuration has 11.5 times the read performance and 27 times the write performance.
|
Node Perf. |
Data Protection |
Measured |
Read Bandwidth (MB/s) |
Measured |
Write Bandwidth (MB/s) |
HDD + NVMe Ceph |
1.5 |
1.27 |
3055 |
4,583 |
506 |
964 |
Micron 6500 ION Ceph |
1 |
1 |
52,540 |
52,540 |
25,800 |
25,800 |
Difference |
|
|
|
11x |
|
27x |
Latency
The HDD + NVMe Ceph configuration has eight times the read latency and 37 times the write latency of the 6500 ION Ceph configuration.
|
Read Latency (ms) |
Write Latency (ms) |
HDD + NVMe Ceph |
290 |
1,760 |
Micron 6500 ION Ceph |
35 |
48 |
Difference |
8x |
37x |
Throughput per TB
A measure of storage performance and efficiency is the amount of performance available per TB. Here we measure throughput in MB/s over both raw capacity and usable capacity.
|
Usable Capacity |
Read Bandwidth (MB/s) / TB |
Write Bandwidth (MB/s) / TB |
HDD + NVMe Ceph |
192TB |
16 |
3.3 |
Micron 6500 ION Ceph |
760TB |
69 |
34 |
Difference |
|
4x |
10x |
The Micron 6500 ION SSD Ceph configuration has four times more read bandwidth per TB and 13 times more write bandwidth per TB when considering usable disk capacity. Note that 3x replication in the HDD + NVMe configuration reduces raw capacity to one-third (576TB / 3 = 192TB), while 4+2 erasure coding in the Micron 6500 ION Ceph configuration reduces raw capacity to four-sixths (1,152TB * 0.66 = 760TB).
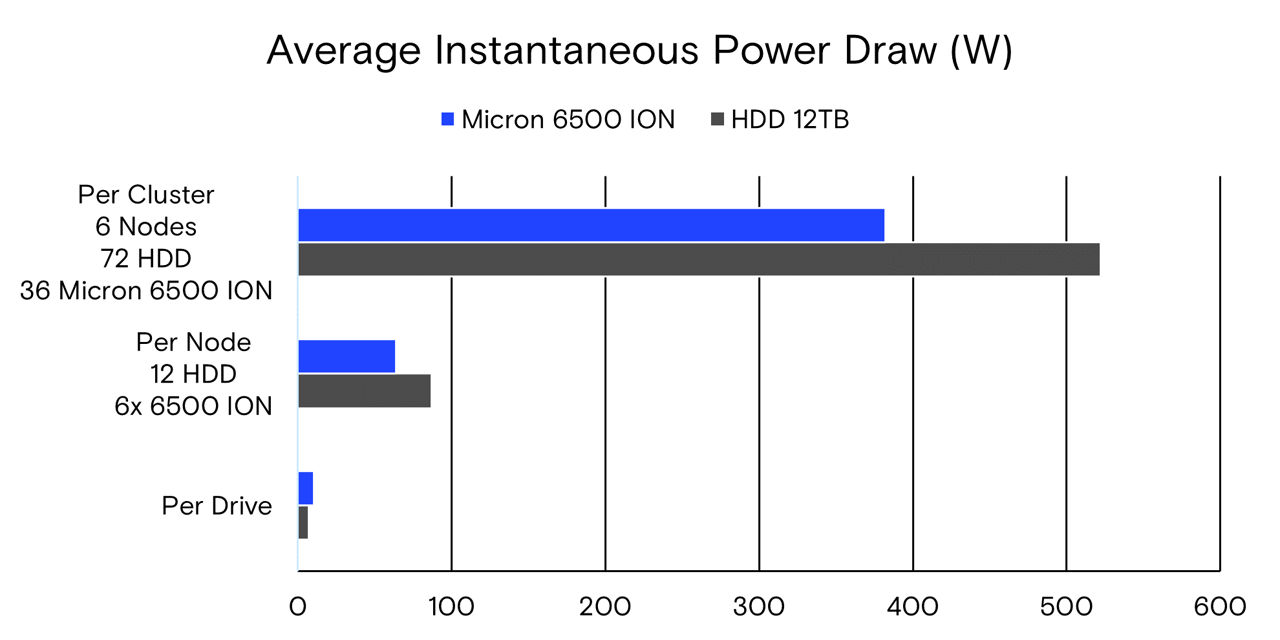
Power draw
The HDD technical brief shows that 12TB HDDs pull 7.25W per drive, or 348W for the storage component of the 4-node solution. For the Micron 6500 ION, we measured the average disk throughput during the test for reads at 1.5GB/s and writes at 1.2GB/s and calculated the power draw per drive at those performance levels. The results were 10.1W for reads and 10.6W for writes. Since there was only one power draw number for the HDD, we chose the higher 10.6W result for comparison.
Power (W) |
Per Drive |
Per Node |
Per Cluster: 6 Nodes |
HDD 12TB |
7.25 |
87 |
522 |
Micron 6500 ION |
10.6 |
64 |
382 |
Difference |
1.5x |
0.7x |
0.7x |
The 30TB Micron 6500 ION uses 1.5 times the power per drive of the 12TB HDD. Because of the delta in capacity, the Micron 6500 ION Ceph solution uses 70% of the HDD + NVMe power draw per node.
Capacity power efficiency (W/TB)
Power draw is a good measure of efficiency in a storage solution. The HDD brief reported the average instantaneous power draw of just the HDD JBOD portion of the Ceph solution, not accounting for the power draw of the CPU, memory and network for the Ceph storage nodes.
For the Micron 6500 ION configuration, we calculated the power draw per drive based on the throughput: 10.1W for reads (at 1.2GB/s) and 10.6W for writes (at 1.5GB/s).
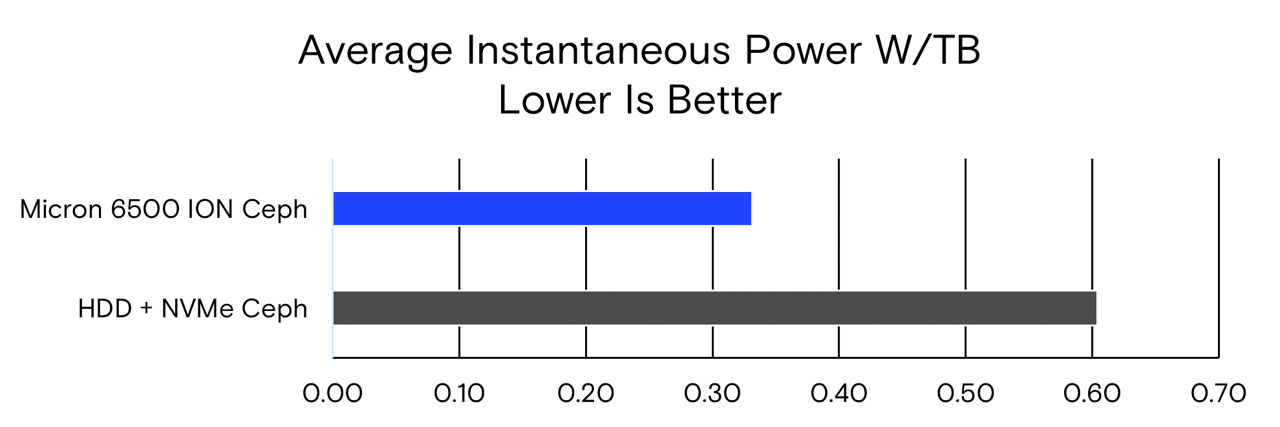
Comparing just the storage component, the Micron 6500 ION Ceph configuration uses a little more than half the power per TB, showing the power efficiency of this NVMe SSD’s configuration over the HDD’s configuration.
Performance power efficiency (W/GBps)
Another power metric to examine is power divided by throughput, telling us how power-efficient the solution is per GBps delivered. Here we continue to use 10.1W per drive for reads and 10.6W per drive for writes on the Micron 6500 ION and the stated 7.25W power draw for the 12TB HDD.
When accounting for power and performance, the HDD + NVMe config uses 16 times more power for reads and 46 times more power for writes.
Solution cost analysis
Using an all-NVMe Ceph configuration enables the use of erasure coding in production. With HDD, it is still strongly recommended to use 3x replication. When taking cost per usable capacity into account, the Micron 6500 ION configuration costs the same as the HDD + NVMe configuration.
Cost per Node |
HDD + NVMe Ceph |
Micron 6500 ION Ceph |
Server, CPU, NIC |
1X |
1.3X |
DRAM |
64GB: 1x |
256GB: 4x |
HDD |
12x 12TB HDD ($200 ea.): $2,400 |
None: $0 |
NVMe |
1x NVMe SSD AIC (1.6TB): $200 |
6x Micron 6500 ION 32TB ($2,000ea): $12k |
Total System Cost |
1x |
2.7X |
Capacity (Raw) |
144TB |
192TB |
Capacity (Usable) |
48TB |
127TB |
Cost/TB (Raw) |
1X/TB |
2X/TB |
Cost/TB (Usable) |
1X/TB |
1X/TB |
To match the usable capacity of the tested 6-node Micron 6500 ION Ceph configuration, a person would need 16 HDD + NVMe nodes. To match the read performance, that person would require 68 HDD + NVMe nodes. And to match the write performance would require 161 HDD + NVMe nodes.
Performance per Node |
Read Bandwidth |
Write Bandwidth |
HDD + NVMe Ceph |
764 MB/s |
161 MB/s |
Micron 6500 ION Ceph |
8,757 MB/s |
4,300 MB/s |
HDD Nodes Required to Match One Micron 6500 ION Node |
11 |
27 |
HDD Nodes Required to Match 6-Node 6500 ION Ceph |
68 |
161 |
Conclusion
The Micron 6500 ION is an exceptionally good fit for NVMe-backed Ceph object stores. It achieves cost parity with HDD when using erasure coding vs. 3x replication on HDD.
The Micron 6500 ION in Ceph offers several benefits:
- More performance than HDD
- 27 times higher write and 11 times higher read performance
- 37 times lower write and eight times lower read latency
- 10 times higher write and four times higher read throughput per usable capacity
- More efficient than HDD
- Half the drive power per TB
- 70% of the power draw for the storage system, not accounting for higher performance on the Micron 6500 ION
- 46 times lower write and 16 times lower read power per GBps
- More cost effective than HDD
- 161 HDD + NVMe nodes to reach the write performance and 68 nodes to reach the read performance of the 6-node Micron 6500 ION Ceph configuration tested
One final point is this: With massively increased performance, the Micron 6500 ION Ceph configuration can process requests quickly and thus return to an idle state more quickly. With a much smaller system footprint, a “hurry up and get to idle” philosophy, and a cost-effective large-capacity NVMe SDD like the Micron 6500 ION, dropping HDDs from object storage finally makes sense.
© 2023 Micron Technology, Inc. All rights reserved. All information herein is provided on an "AS IS" basis without warranties of any kind. Products are warranted only to meet Micron’s production data sheet specifications. Products, programs, and specifications are subject to change without notice. Micron Technology, Inc. is not responsible for omissions or errors in typography or photography. Micron, the Micron logo, and all other Micron trademarks are the property of Micron Technology, Inc. All other trademarks are the property of their respective owners. Rev. A 01/2023 CCM004-676576390-11635