Login / Register

Our diversity, equality and inclusion (DEI) commitments
At Micron, our bold and global DEI commitments help us create opportunities for all to go beyond the norm and achieve greatness.

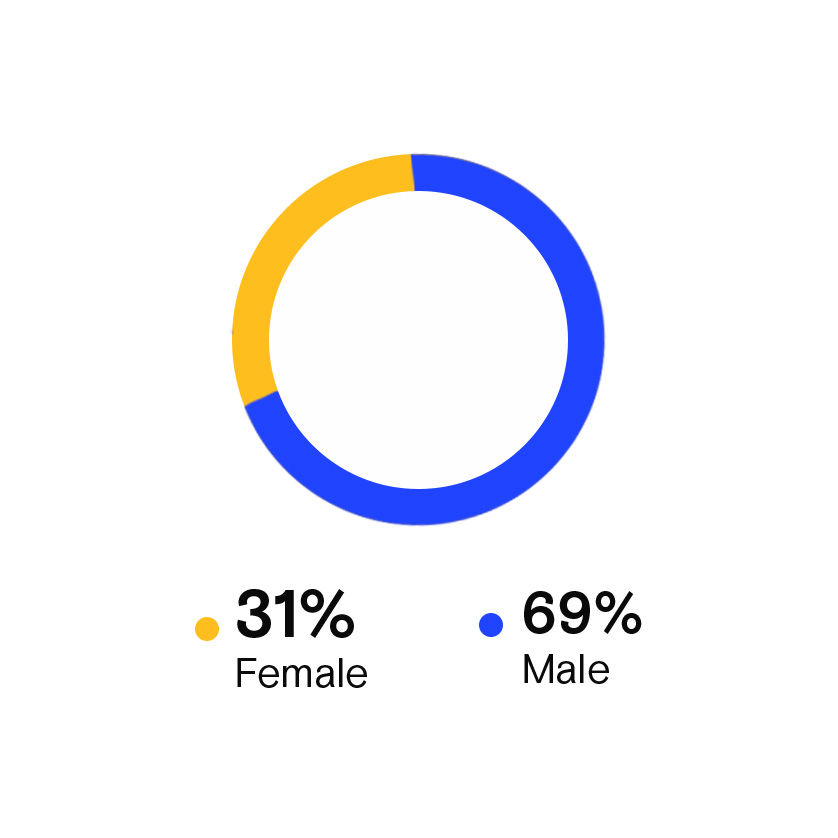
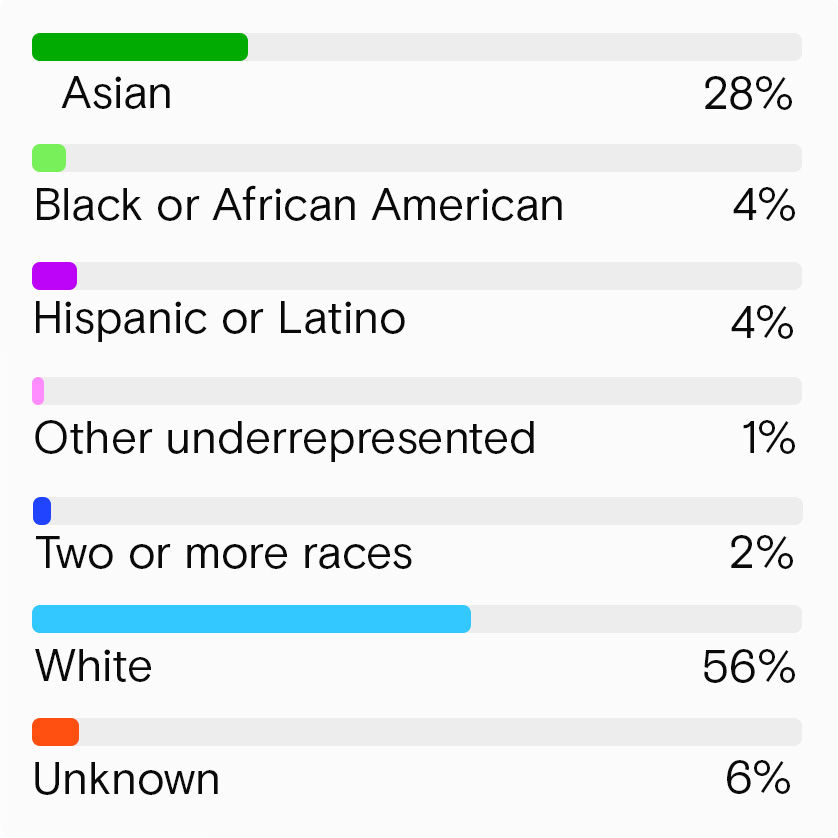
2023 overall diversity snapshot¹
2023 diversity breakdown by sector¹
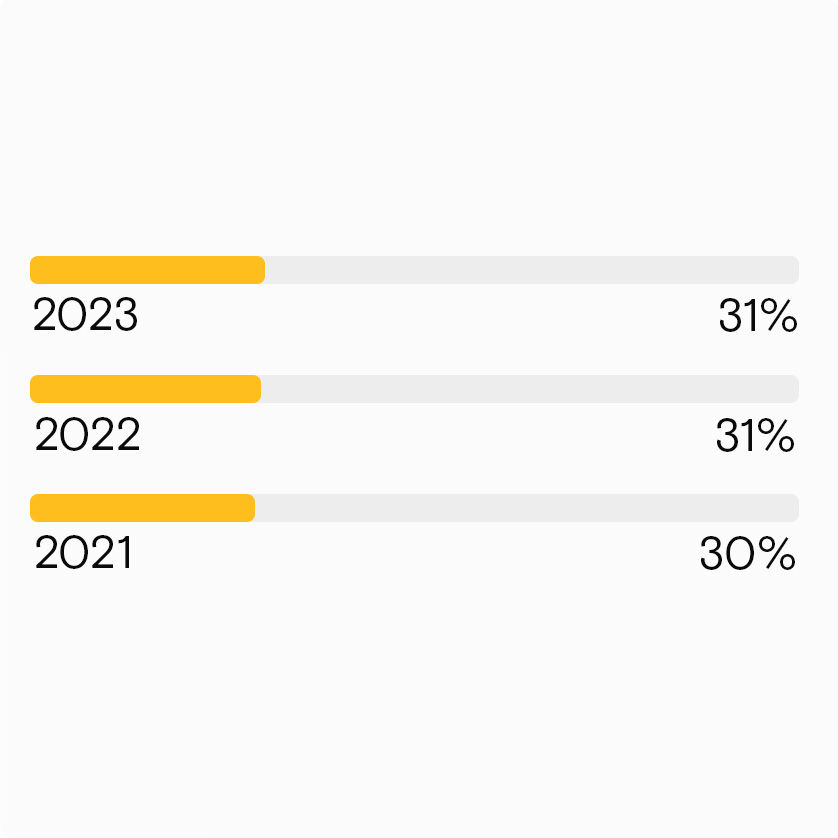
Global gender breakdown |
|
Gender |
Percentage |
|---|---|
| Female | 17% |
| Male | 83% |
US ethnicity breakdown |
|
Ethnicity |
Percentage |
|---|---|
| Asian | 29% |
| Black or African American | 2% |
| Hispanic or Latino | 3% |
| Other underrepresented ethnicities | 0% |
| Two or more races | 1% |
| White | 59% |
| Unknown | 6% |
Global gender breakdown |
|
Gender |
Percentage |
|---|---|
| Female | 21% |
| Male | 79% |
US ethnicity breakdown |
|
Ethnicity |
Percentage |
|---|---|
| Asian | 27% |
| Black or African American | 2% |
| Hispanic or Latino | 3% |
| Other underrepresented ethnicities | 1% |
| Two or more races | 2% |
| White | 59% |
| Unknown | 6% |
Global gender breakdown |
|
Gender |
Percentage |
|---|---|
| Female | 25% |
| Male | 75% |
US ethnicity breakdown |
|
Ethnicity |
Percentage |
|---|---|
| Asian | 29% |
| Black or African American | 3% |
| Hispanic or Latino | 4% |
| Other underrepresented ethnicities | 1% |
| Two or more races | 2% |
| White | 55% |
| Unknown | 6% |
Global gender breakdown |
|
Gender |
Percentage |
|---|---|
| Female | 54% |
| Male | 46% |
US ethnicity breakdown |
|
Ethnicity |
Percentage |
|---|---|
| Asian | 21% |
| Black or African American | 6% |
| Hispanic or Latino | 5% |
| Other underrepresented ethnicities | 1% |
| Two or more races | 2% |
| White | 61% |
| Unknown | 5% |
Diversity data archive¹
Global gender breakdown |
|
Gender |
Percentage |
|---|---|
| Female | 31.1% |
| Male | 68.9% |
US ethnicity breakdown |
|
Ethnicity |
Percentage |
|---|---|
| Asian | 26.6% |
| Black or African American | 3.9% |
| Hispanic or Latino | 4.6% |
| Other underrepresented ethnicities | 0.7% |
| Two or more races | 1.9% |
| White | 57.2% |
| Unknown | 5.1% |
Global gender breakdown |
|
Gender |
Percentage |
|---|---|
| Female | 17.6% |
| Male | 82.4% |
US ethnicity breakdown |
|
Ethnicity |
Percentage |
|---|---|
| Asian | 33% |
| Black or African American | 2.1% |
| Hispanic or Latino | 1% |
| Other underrepresented ethnicities | 0% |
| Two or more races | 3.1% |
| White | 56.7% |
| Unknown | 4.1% |
Global gender breakdown |
|
Gender |
Percentage |
|---|---|
| Female | 16.7% |
| Male | 83.3% |
US ethnicity breakdown |
|
Ethnicity |
Percentage |
|---|---|
| Asian | 29.5% |
| Black or African American | 1.3% |
| Hispanic or Latino | 2.3% |
| Other underrepresented ethnicities | 0.4% |
| Two or more races | 1.7% |
| White | 60.6% |
| Unknown | 4.1% |
Global gender breakdown |
|
Gender |
Percentage |
|---|---|
| Female | 20.3% |
| Male | 79.7% |
US ethnicity breakdown |
|
Ethnicity |
Percentage |
|---|---|
| Asian | 26.2% |
| Black or African American | 2.3% |
| Hispanic or Latino | 2.7% |
| Other underrepresented ethnicities | 0.5% |
| Two or more races | 1.5% |
| White | 62.1% |
| Unknown | 4.7% |
Global gender breakdown |
|
Gender |
Percentage |
|---|---|
| Female | 24% |
| Male | 76% |
US ethnicity breakdown |
|
Ethnicity |
Percentage |
|---|---|
| Asian | 27.8% |
| Black or African American | 3.5% |
| Hispanic or Latino | 4.6% |
| Other underrepresented ethnicities | 0.7% |
| Two or more races | 1.9% |
| White | 56.3% |
| Unknown | 5.3% |
Global gender breakdown |
|
Gender |
Percentage |
|---|---|
| Female | 54.5% |
| Male | 45.5% |
US ethnicity breakdown |
|
Ethnicity |
Percentage |
|---|---|
| Asian | 19.9% |
| Black or African American | 6.4% |
| Hispanic or Latino | 4.8% |
| Other underrepresented ethnicities | 0.7% |
| Two or more races | 2% |
| White | 62.3% |
| Unknown | 3.9% |
Year |
Malays in Singapore |
|---|---|
| 2023 | 4% |
| 2022 | 5% |


Additional resources
1. Percentage may not total 100 due to rounding.